
Programmed-temperature retention times are notoriously difficult to harness for compound identification because they are influenced by so many experimental factors. While some factors are controllable (temperature program, flow rate, column make/model, etc.), some are not easily controlled (oven calibration errors, flow rate errors, column dimensions, etc.) and may even vary from run to run.
Linear retention indexing (LRI) was introduced to improve the reproducibility of programmed-temperature retention times. With LRI, you first spike your sample with a set of standard compounds (typically n-alkanes) and subject it to programmed-temperature elution. Then, rather than reporting the retention of each compound as a time, it is reported as index that describes where a compound elutes between the nearest two bracketing standards. Since the bracketing standards experience nearly the same conditions as the other compounds, LRIs are less sensitive than retention times to small differences in the experimental conditions.
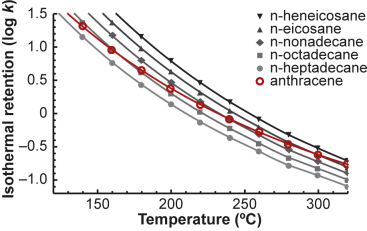
Even so, the accuracy of LRIs drop considerably when experimental conditions change from those originally used to measure them. The figure on the right shows why - it plots the isothermal retention (in terms of log k) of six compounds as a function of the temperature. Retention indexing assumes that anthracene (in red) will always elute at the same position between the two bracketing n-alkanes, but that is clearly not the case. For example, if we measured a retention index for anthracene at 140 °C and tried to use it at 320 °C, it would be terribly inaccurate. In fact, anthracene doesn't even elute between the same pair of n-alkanes at 320 °C - it elutes between the pair of n-alkanes three CH2 units longer than expected! Similarly, the more the temperature program, the flow rate/inlet pressure, or the column dimensions are changed from those originally used to measure LRIs, the more their accuracy generally drops. Even unavoidable differences between GC instruments can be enough to significantly reduce their accuracy. (Method translation, however, may be used to find a subset of experimental conditions for which retention indices should remain the same, but it greatly restricts the range of available experimental conditions and still cannot properly account for differences between GC instruments.)
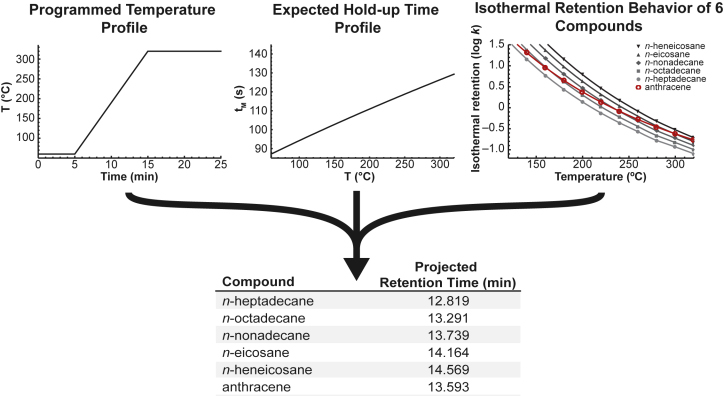
Still, the isothermal retention information shown in the previous figure can be easily measured, so another approach to predicting programmed-temperature retention is to calculate it (or "project" it) from the isothermal retention data. To do this, one can use the fundamental equation of programmed-temperature elution, plugging in the isothermal retention information for each compound along with the programmed temperature and hold-up time profiles (see below). Retention projection has the major advantage that it could accurately predict retention times with virtually any temperature program, flow rate/inlet pressure, film thickness, carrier gas type, and column dimensions, so long as the stationary phase material is chemically identical to that used to measure the isothermal retention data, because it accounts for the differences in a theoretically sound way.
Unfortunately, in practice, it isn't very accurate. That's mainly because the actual temperature program and hold-up time profiles produced by GC instruments are imperfect. Even in modern GC ovens, temperature calibration is only accurate to +/- 3-5 °C and hold-up times are heavily influenced by small differences in the column dimensions and inlet pressure/flow rate calibration. So far, the only way to calculate accurate retention times is to first make extremely precise measurements of the temperature and hold-up time profiles produced by the GC instrument. But this makes retention projection highly impractical for most GC users.
We developed a new methodology that solves this problem. You simply spike your sample with a set of n-alkanes and run the sample under programmed-temperature elution. Then you use the retention times of the n-alkane standards to back-calculate what the effective temperature and hold-up time profiles must have been in order to produce those retention times. The back-calculated profiles can then be used to project the retention times of other compounds with extremely high accuracy. The approach is very simple for the user and enables accurate retention prediction under a wide range of experimental conditions (we have shown that it remains accurate under a wide range of temperature programs, flow rates, inlet pressures, and column dimensions) and on virtually any GC instrument.
The GC Retention Predictor enables you to accurately predict retention under a wide range of temperature programs, flow rates, inlet pressures, and column dimensions. However, the stationary phase must be held constant. You must currently use Agilent's DB-5MS UI columns. In the future, we will add additional types of columns.
Also note that at this point in time, this site is only useful to show how this new method of retention prediction works. It is not generally useful as a tool to predict GC retention because the retention database only contains measurements for ~90 compounds. In the future, we plan to build a much larger database.
To use the GC Retention Predictor, you would perform the following steps (note that this is a general procedure; we will provide a more detailed protocol in the future):
Step #1: Spike your sample with a standard mixture we will provide of 25 n-alkanes and subject it to programmed-temperature or isothermal elution.
Step #2: Run GC Retention Predictor and enter the make/model of column used and its length (DB-5MS UI, 0.25 mm inner diameter, 0.25 μm film thickness is currently the only option).
Step #3: Enter the inlet pressure/flow rate, whether the column outlet is under vacuum or at ambient pressure, and the temperature program used in the run.
Step #4: Enter the retention times of all the n-alkane standards measured in your run.
Step #5: The software back-calculates the effective temperature and hold-up time profiles produced by their instrument in the run.
Step #6: The back-calculated profiles are used to project the retention times of the other compounds for which we have measured isothermal k vs. T relationships on the DB-5MS UI column.
(1) Boswell, P. G.; Carr, P. W. Cohen, J. D.; Hegeman, A. D. "Easy and accurate calculation of programmed temperature gas chromatographic retention times by back-calculation of temperature and hold-up time profiles." Journal of Chromatography A. 2012, 1263, 179-88. 10.1016/j.chroma.2012.09.048
 Except where otherwise noted, all content on this site is licensed under a